
From SLO to Health Checks: How Visual Dashboards Become an Operational Baseline
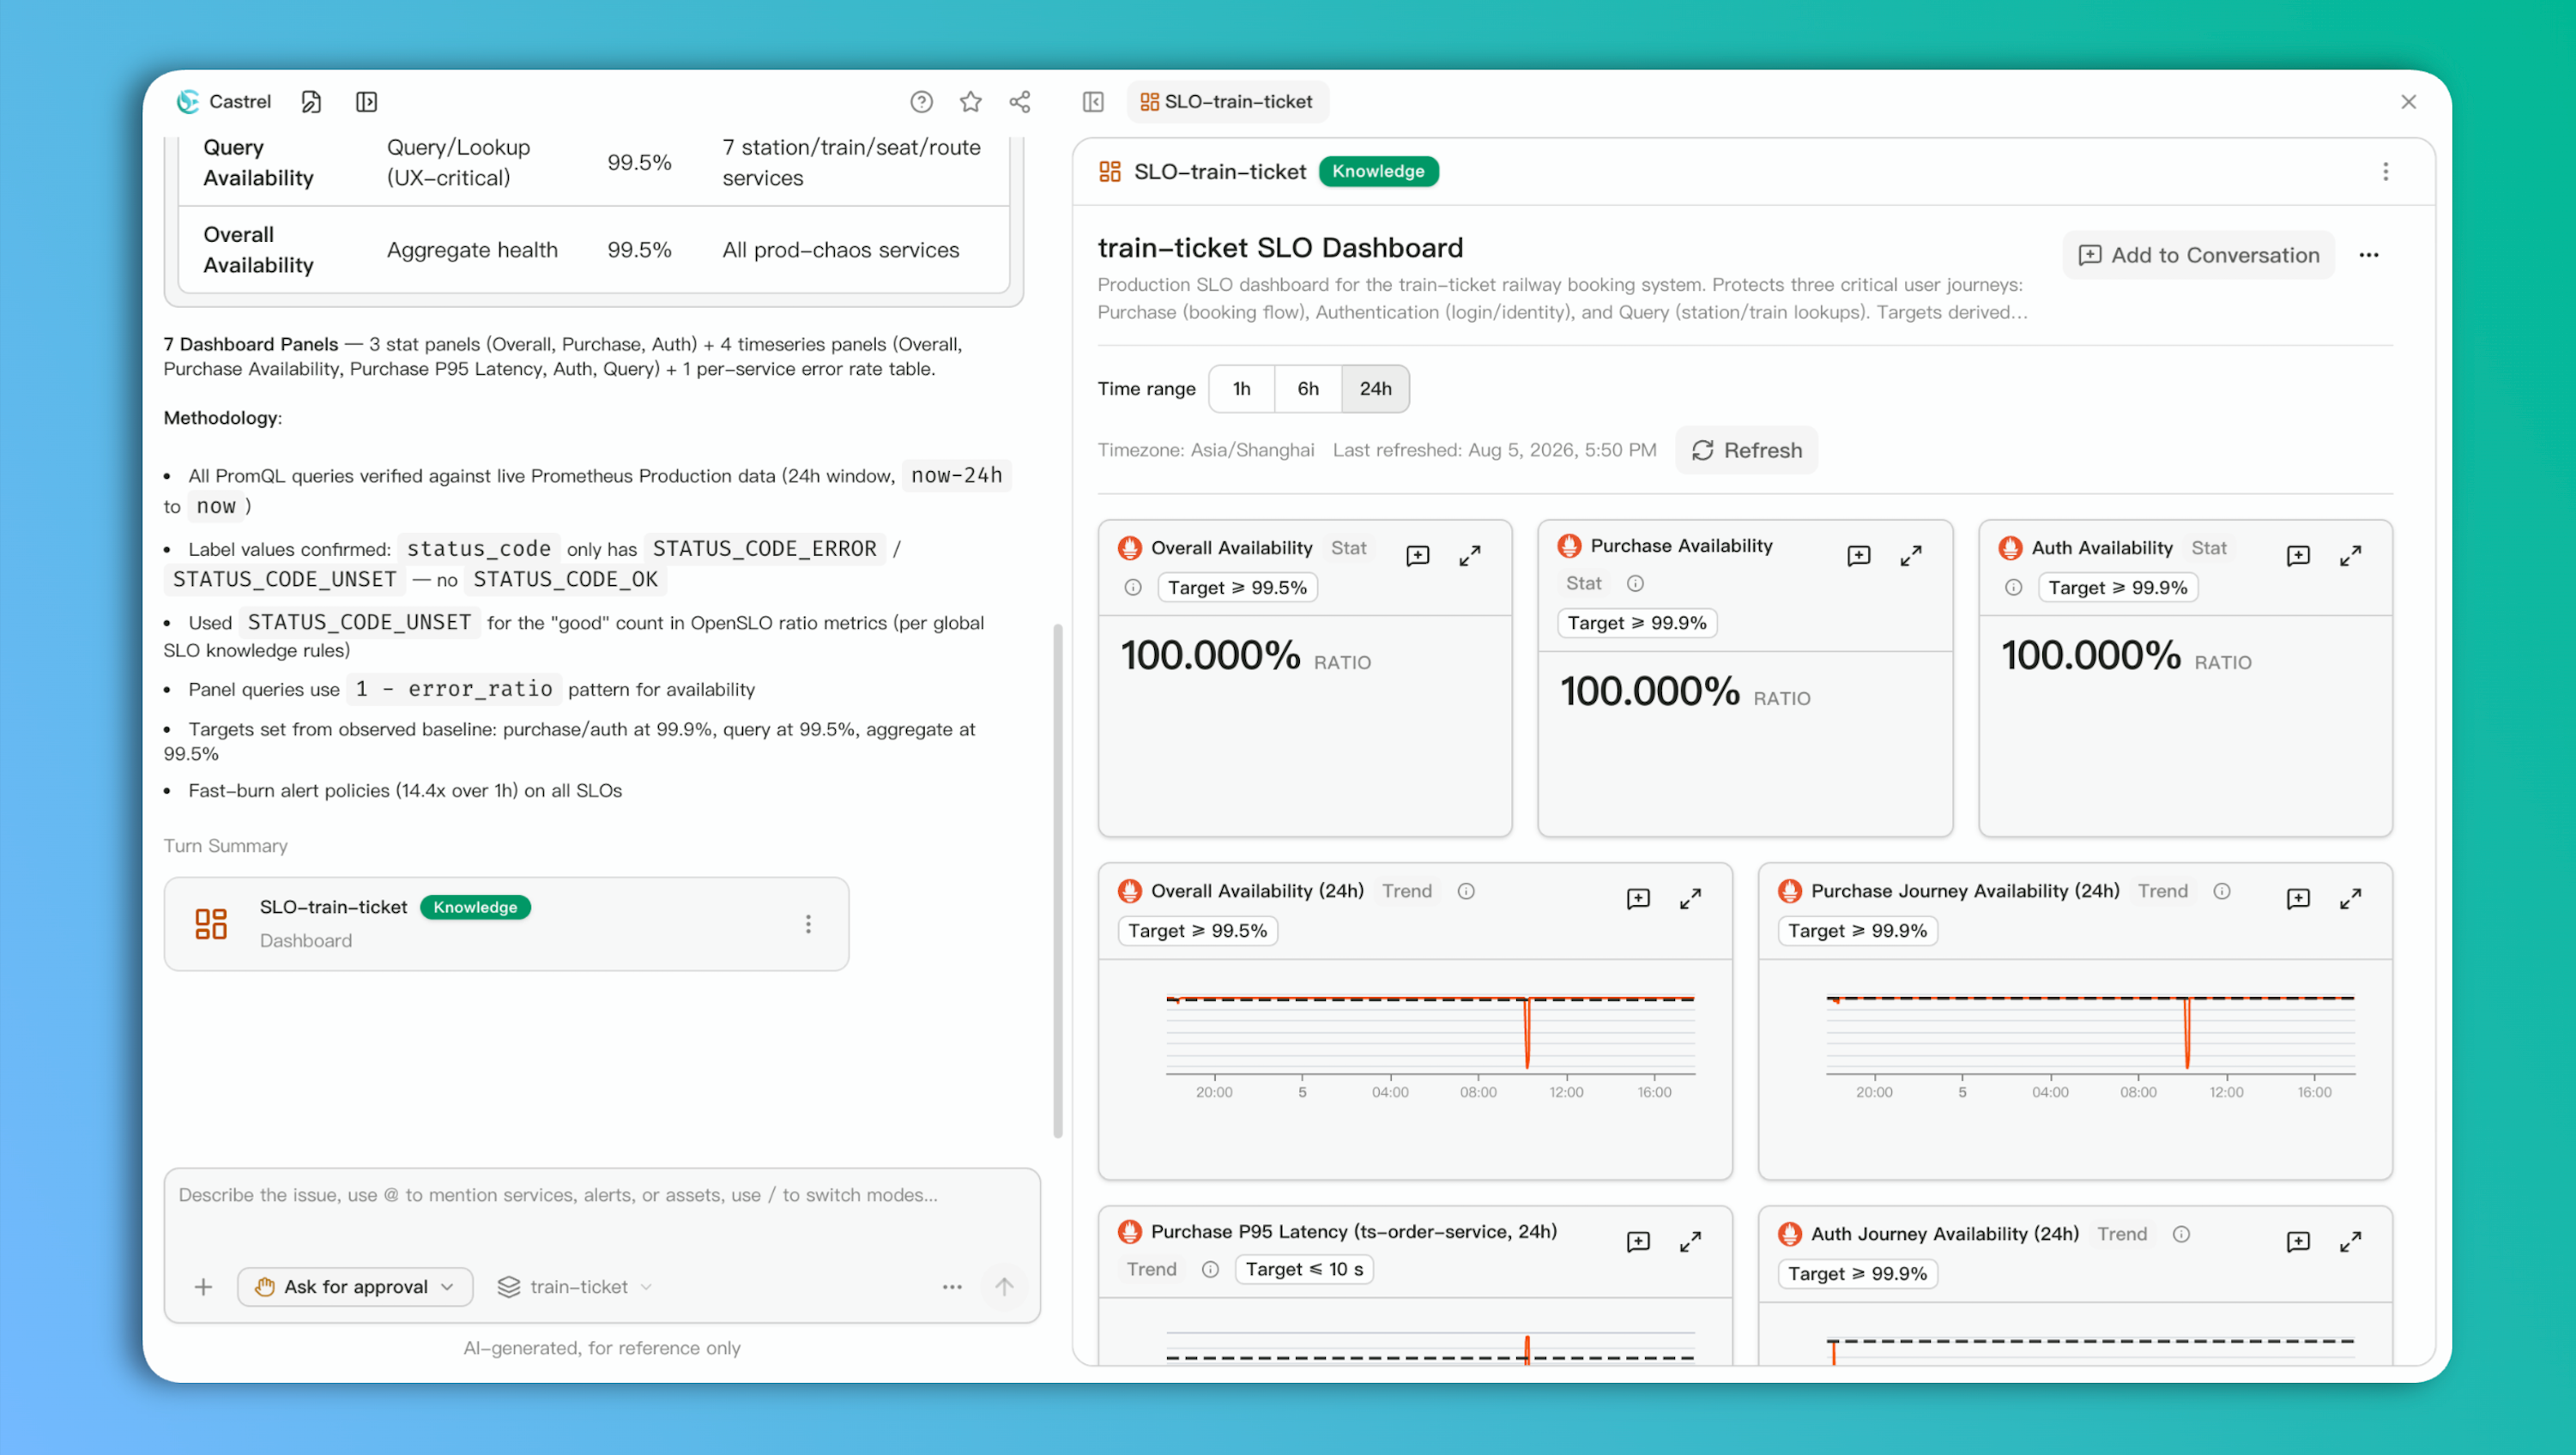
An SLO is easy to write down and hard to make useful.
Most teams already have metrics, traces, dashboards, and alert rules. What they often do not have is a shared, defensible answer to a more important question: what must stay healthy for the business to work? Turning that answer into service-level objectives requires more than choosing a percentage. Someone has to identify the critical user journey, find a representative traffic window, validate the underlying queries, set targets with evidence, and build a dashboard that people can keep using.
Castrel can take over that middle part of the work. A user can ask for an SLO for an application, and Castrel can read the application context, explore observability data, define the objectives, generate a visual dashboard, and preserve the result as application knowledge. The result is not just a document or a chart. It is an operational baseline that later health checks can use.
That is the real value of this capability: an SLO is no longer a rule written once at a single point in time. It becomes application context that people can review and agents can reuse. Later inspections, reviews, and recalibration work can start from the same objectives, thresholds, queries, and historical reasoning instead of rebuilding the criteria from scratch.
The real problem: SLOs are usually disconnected from daily operations
In many organizations, SLO work begins with good intentions and ends as an isolated artifact. A target may be written in a document, a few PromQL queries may live in a dashboard, and the service owner may know which path matters most. But the reasoning is spread across people and tools.
That creates a recurring manual process:
- Find the service inventory, topology, runbooks, and previous inspection reports.
- Decide which user journey is truly business-critical.
- Switch between metrics, traces, and Kubernetes data to find a period of representative traffic.
- Check error rates, latency, availability, restarts, and resource pressure.
- Convert those observations into targets and dashboard queries.
- Rebuild that context when the next health check or incident review begins.
The problem is not that engineers cannot do this work. It is that the work is fragmented, difficult to review, and difficult to reuse. A dashboard without the target rationale is hard to trust. A written SLO without a live view is hard to operate. And a health check that starts without the original business context often turns into another round of metric collection.
A typical SLO workflow: start with the journey, not the metric
Consider a typical microservices application with a ticket-booking flow. The observed critical path was:
ts-ui-dashboard → ts-travel-plan-service → ts-order-service
A request to create an SLO should not begin by assuming that the latest metric is a valid baseline. In this workflow, recent traffic was very low, so a current 24-hour view could not represent normal customer behavior. Castrel read the application context and the existing inspection SOP, then examined seven days of Prometheus data to locate an earlier window with meaningful business traffic.
It used the period from July 28 to July 31 as the working baseline and checked three core signals:
- service error rates across the
prod-chaosnamespace; - P95 latency for the order service and other active services;
- Kubernetes Deployment readiness.
The data mattered because it shaped the objectives. During the active window, most active services had observed error rates in the 5–15% range, while ts-consign-service showed a persistent 100% error rate. ts-order-service had a P95 latency generally between 1 and 8 seconds, and Deployment readiness remained at 100%. These are observations from this specific workflow, not universal SLO defaults.
Castrel turns the investigation into an operating dashboard
Based on the journey, the historical baseline, and the live data model, Castrel generated four OpenSLO definitions.
| SLO | Target | Scope | Operational purpose |
|---|---|---|---|
| Booking journey availability | ≥ 95% | Services in the prod-chaos namespace | Protect the core transaction path |
| Infrastructure readiness | 100% | Kubernetes Deployments in prod-chaos | Detect platform-level unavailability |
| Order service P95 latency | ≤ 10 seconds | ts-order-service | Detect degradation that affects ordering experience |
| Active service coverage | ≥ 60% | Services with traffic / observed services | Detect silent or gradual service degradation |
The availability objective uses non-error requests divided by total requests. Infrastructure readiness compares available replicas with desired replicas. The latency objective tracks the order service's P95 span duration. Active service coverage makes low-traffic and silent-service conditions visible instead of treating them as an empty chart.
Those objectives are then rendered as a 10-panel dashboard, rather than being left as configuration alone:
- Booking journey availability
- Infrastructure readiness
- Order service P95 latency
- Active service coverage
- Error rate by service
- Request rate by service
- P95 latency by service
- Pod restart health in a 30-minute window
- Containers above 85% memory utilization
- Top five services by error rate
This creates a view that connects a business objective with the signals needed to investigate a deviation. Teams can see whether a journey is unhealthy, whether the platform is ready, which services have traffic, and which resource or stability signals require attention.
Validation is part of the output
Generating a query is not the same as generating a usable panel.
In this workflow, the memory-risk panel initially failed to load. Castrel validated the query directly against Prometheus and identified duplicate time series during the metric join. The same pod and container labels appeared across multiple series because of differing id labels.
Castrel corrected the query by aggregating both sides with sum by (pod, container), joining on pod and container, and adding or vector(0) so that an absence of matching data does not produce an empty result. The corrected query returned data, and Castrel updated the dashboard configuration.
That distinction is important. The output is not merely a proposed YAML file. The workflow records a real data-source check, a diagnosis when a query fails, and an updated dashboard that can be loaded and used.
Why the dashboard matters after it is created
The dashboard is useful immediately, but its longer-term value comes from being preserved as application knowledge.
When the SLO dashboard is archived with the application, it retains more than visual panels:
- the objectives and targets;
- the Prometheus queries and service scope;
- the critical journey and priority tiers;
- the historical baseline used to set the targets;
- the notes about low traffic, data gaps, and known persistent issues.
That gives later health checks a shared starting point. Instead of beginning with, “Which services matter?” or “What should normal look like?”, a health-check workflow can evaluate the existing SLOs, inspect their supporting panels, and report deviations in business terms.
But SLOs are not the entire health check. The four objectives define the business outcomes to protect first and the thresholds used to judge them. A complete inspection also examines the signals that explain a deviation: error rate and request volume across every service, service latency, active alerts, Pod restarts, memory pressure, traces, and logs. SLOs tell the inspection where to start and what a deviation means; cross-signal analysis determines where it is happening, whether it is expanding, and how to investigate it next.
How a health check uses the dashboard—not just four rules
In a later health check, Castrel first read the archived SLOs and used booking availability, infrastructure readiness, order-service P95 latency, and active-service coverage as its operating spine. It then checked the current 24-hour window against a seven-day comparison window, in parallel, for service error rate and request volume, P95 latency across services, Prometheus alerts, Pod restarts, and container memory. The findings were then summarized against service topology and operational priority.
This lets the health check distinguish whether a rule is met from why it may be drifting:
| Inspection layer | Signals reviewed | How the inspection interpreted them |
|---|---|---|
| Service objectives | Booking availability, infrastructure readiness, order P95 latency, active-service coverage | Booking availability fell to 0.54% and order-service P95 reached 14.3 seconds, even while all 41 Deployments remained 1/1 ready |
| Service behavior | Error rate, request rate, P95 latency, top error-rate services | Travel, payment, order, and gateway paths showed intermittent high error rates or latency spikes, identifying where attention should start |
| Infrastructure and resource risk | Pod restarts, container memory, Deployment replicas | ts-ticket-office-service showed a recurring restart pattern and ts-travel-service used about 87% memory; both are risks to track, but neither alone explains every latency spike |
| Alerting and root-cause drill-down | Firing alerts, alert history, traces, logs | Once error-rate and latency alerts appear, the workflow can move from Prometheus into slow and error spans, then related logs, to validate a shared dependency, request path, or service-level problem |
As a result, a 100% infrastructure-readiness score does not cause the application to be labeled healthy by default. The health check continues to assess SLO violations, elevated error rates, latency spikes, clustered alerts, and resource risk—and relates those signals back to the affected business journey.
For example, a later inspection can distinguish between these situations:
- a Tier-1 booking-availability objective is burning error budget;
- infrastructure readiness has departed from its 100% baseline;
- order latency is rising while availability still appears healthy;
- service coverage has fallen because traffic has disappeared from part of the application;
- memory pressure or restart activity is increasing before it changes the customer journey.
The SLO baseline does not replace judgment. When traffic patterns change, data sources are incomplete, or the product evolves, targets must be reviewed and recalibrated. In the workflow above, the application was in a low-traffic state, so the dashboard explicitly recorded that its targets should be revisited when normal traffic returns. Preserving that qualification is as important as preserving the number itself.
From one request to a reusable operational baseline
The value of SLO automation is not just faster dashboard creation. It is the continuity between initial definition and ongoing operations.
Castrel helps teams move through a connected workflow:
Application context + observability data
    → journey and baseline discovery
    → validated OpenSLO definitions
    → visual dashboard
    → archived application knowledge
    → full health check: objective evaluation + cross-signal explanation
    → recalibration
With this approach, an SLO is no longer a one-time promise in a document. It becomes a visual, testable operating baseline: one that gives health checks business priorities and evaluation criteria. The inspection then combines service-wide, infrastructure, alerting, trace, and log signals to explain the system's actual condition—and to keep the objectives current as the application changes.