
Unified Alert Management: Unified Multi-Source Alert Processing & Troubleshooting
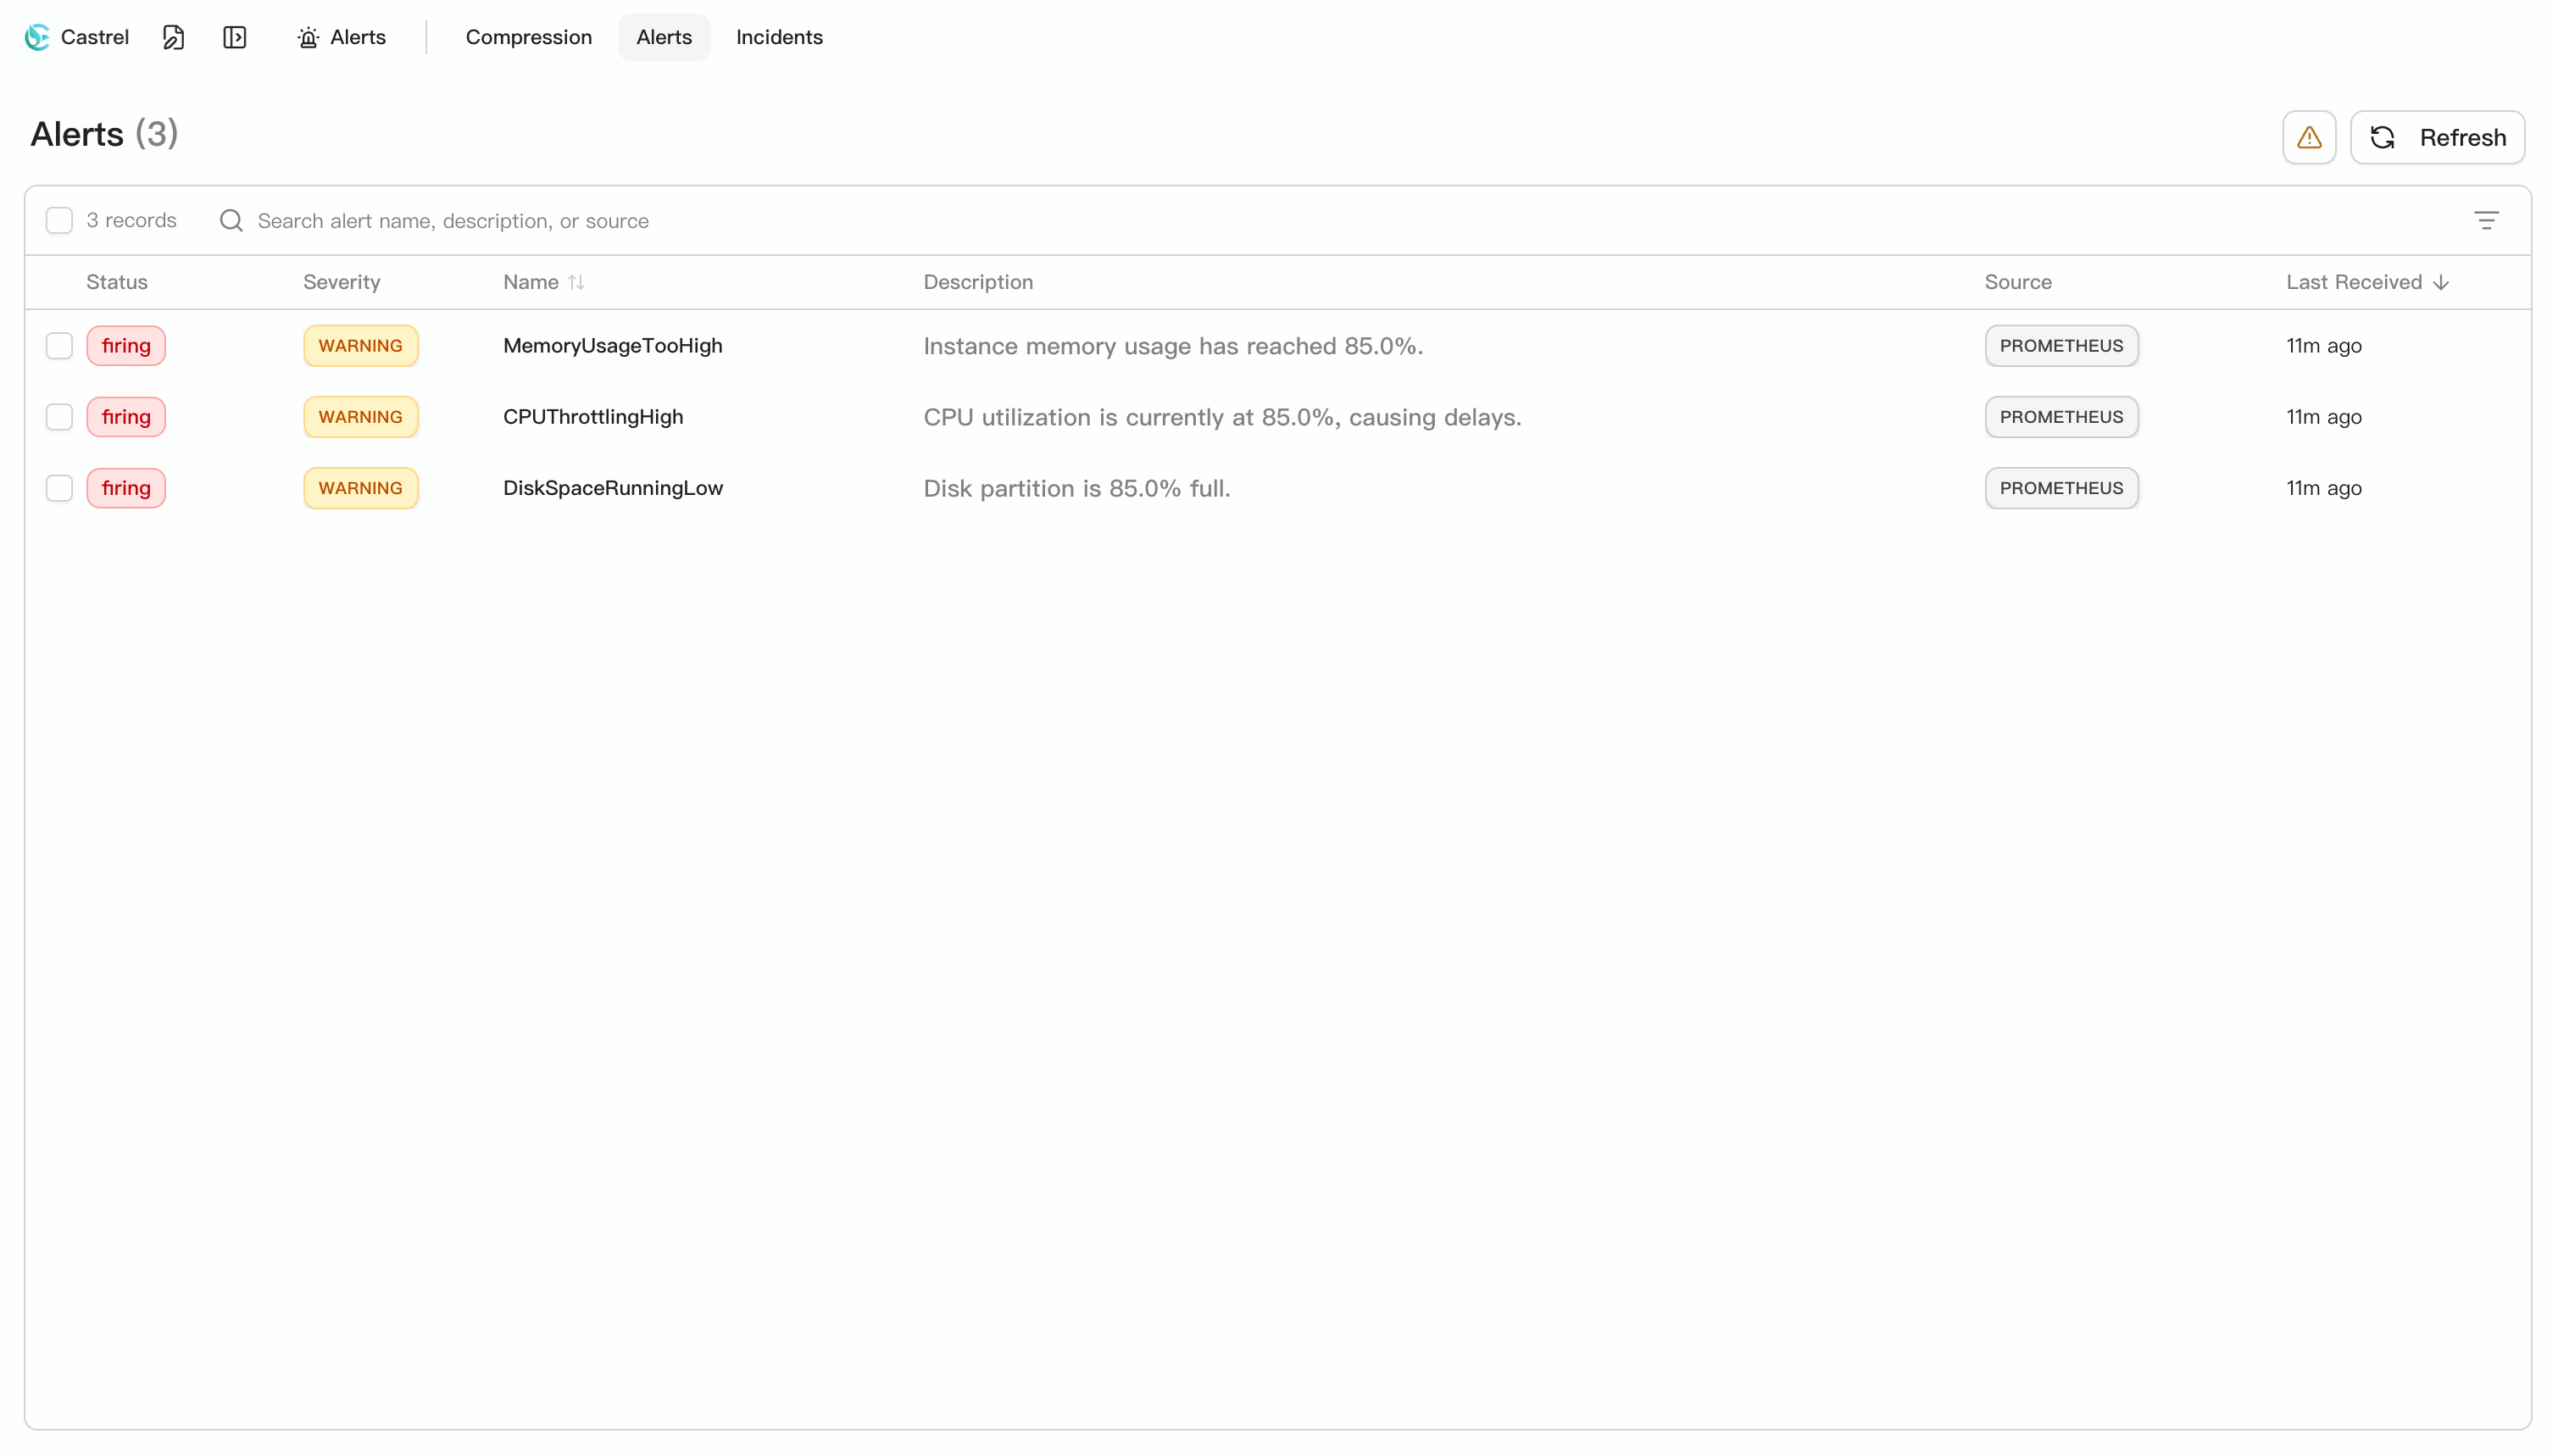
New Feature: Unified Alert Management
When managing multiple monitoring systems, operations teams often face alerts scattered across different platforms. Troubleshooting demands manual aggregation and guesswork about correlations — a fragmented process that slows everything down.
Unified Alert Management brings alerts from different sources together into a single processing interface. Taking Prometheus as an example, the integration page includes a built-in toggle that lets you start or stop alert syncing with a single click — turn it on and alerts flow into the unified management console automatically, turn it off and pulling stops right away, no need to touch connector settings.
Once alerts from Prometheus, Zabbix, and other monitoring sources enter the unified management console, they are deduplicated and aggregated through default or customizable compression rules, producing structured alerts that keep critical signals from being buried in noise.
When deeper investigation is needed, you can turn one or more related alerts into an incident and bind it to the relevant service or application — making the incident the organizing unit for your troubleshooting effort. Once created, associated alerts can be flexibly added or removed, and every step of the investigation revolves around the incident with full context at hand.
Full Release Checklist
feat
- Introduced Unified Alert Management, organizing multi-source alerts around incidents with compression, incident creation and linking, and troubleshooting — with initial support for Prometheus and Zabbix. The Prometheus integration page includes a one-click toggle to quickly start or stop alert pulling.
- Optimized built-in slash commands (/goal, /loop, /deploy, /slo, etc.) with chip-based input, and added goal display and background task management sections to the session detail panel.
bugfix
- Fixed an issue where display_name and item_id were assigned incorrect values when uploading Skills.